QuickHomeservices Get Support 24/7
Sales Report
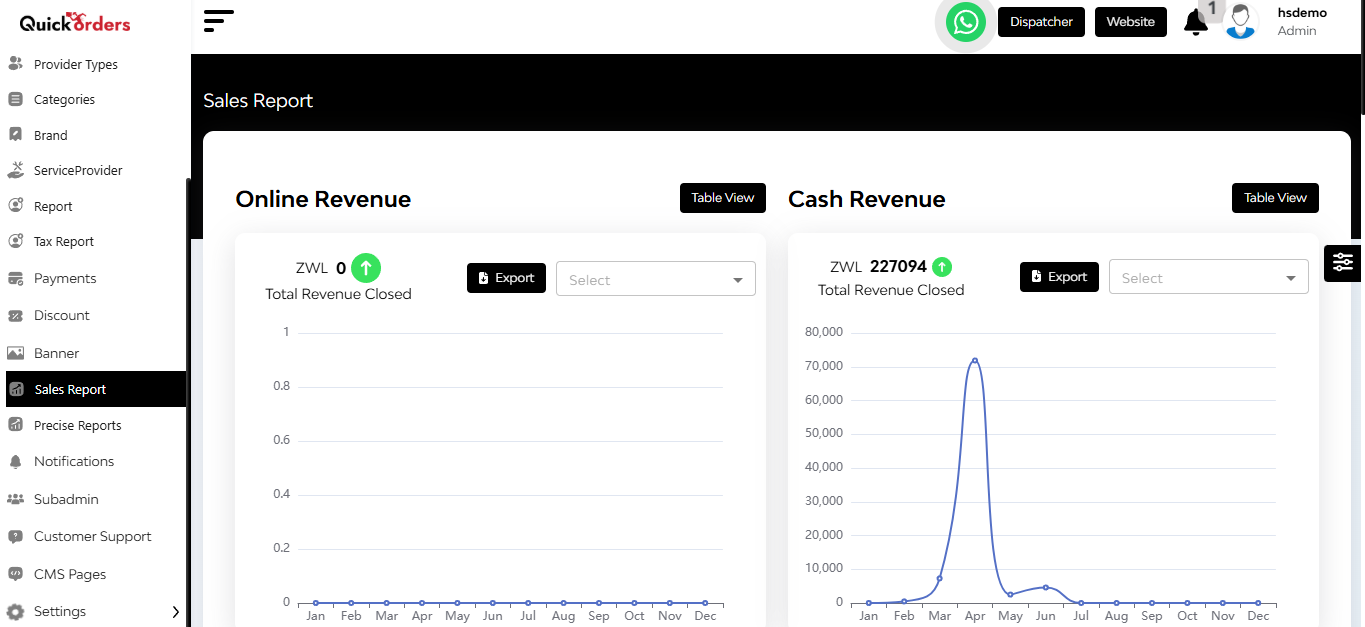
The Sales Report section offers powerful insights into the financial performance of your provider, allowing admins to evaluate revenue generation across various parameters.
Here you can get a full visual and analytical view of the business’s revenue flow, category performance, and financial trends. You can also export data for deeper analysis.

Monthly Revenue Overview (Interactive Line Chart)
- Displays daily revenue trends over the selected month
- Highlights income fluctuations and peak earning days
- Switch between months to compare historical trends
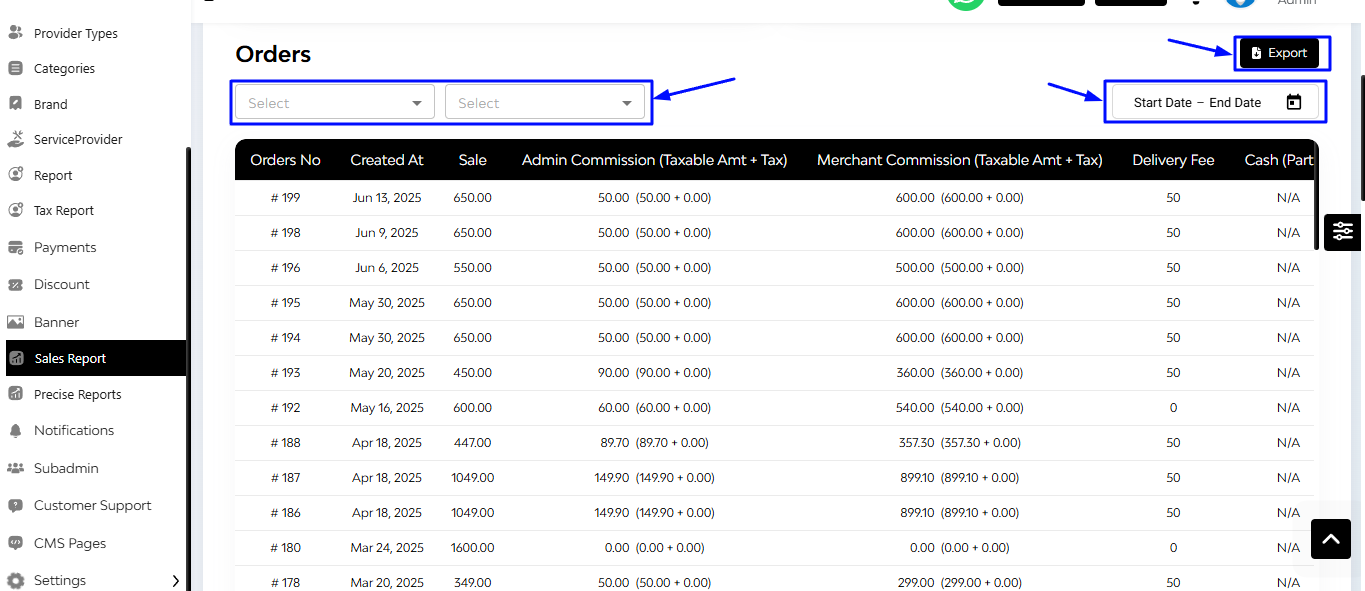
After that, you can see the detailed view of the order in a tabular form based on order no, created at, admin commission, merchant commission, delivery fee, cash, and wallet.

Filter Options
- Select Time Frame: Daily, Monthly, Quarterly, Yearly
- Select Providers
- Set Date Range
- Export all filtered data
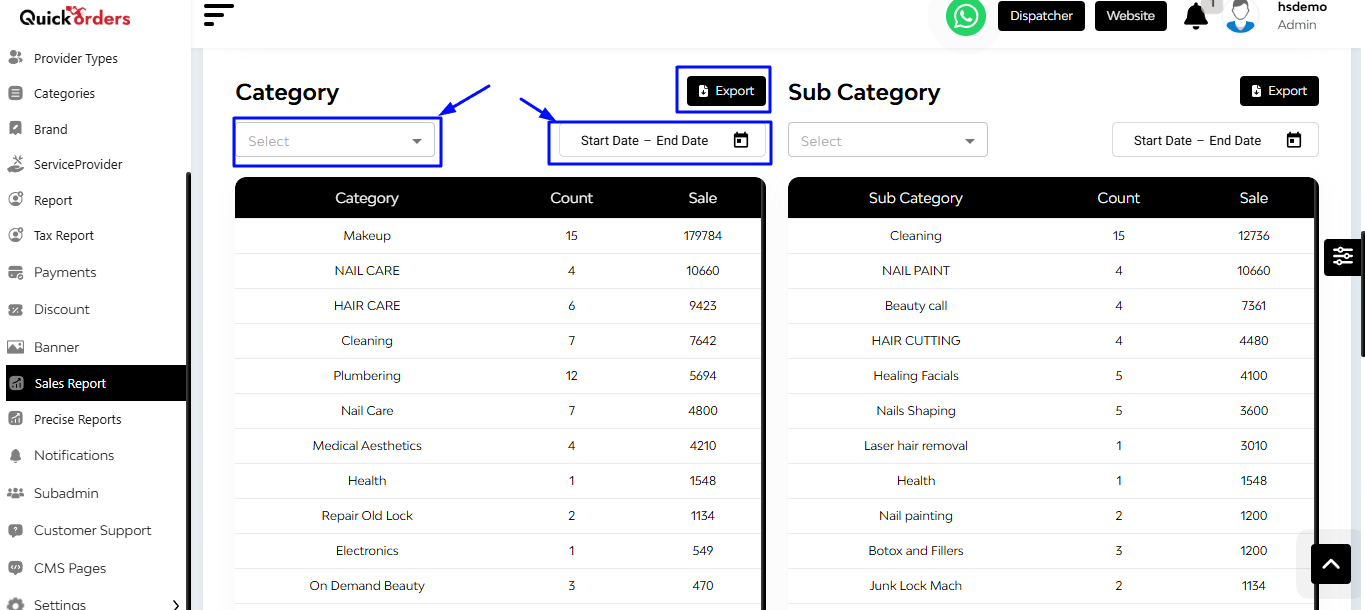
Category & Sub-Category Analysis

You can also check the detailed report on the basis of category and sub-category, provider and products. Put the time frame and date range filter and get the detailed overview.
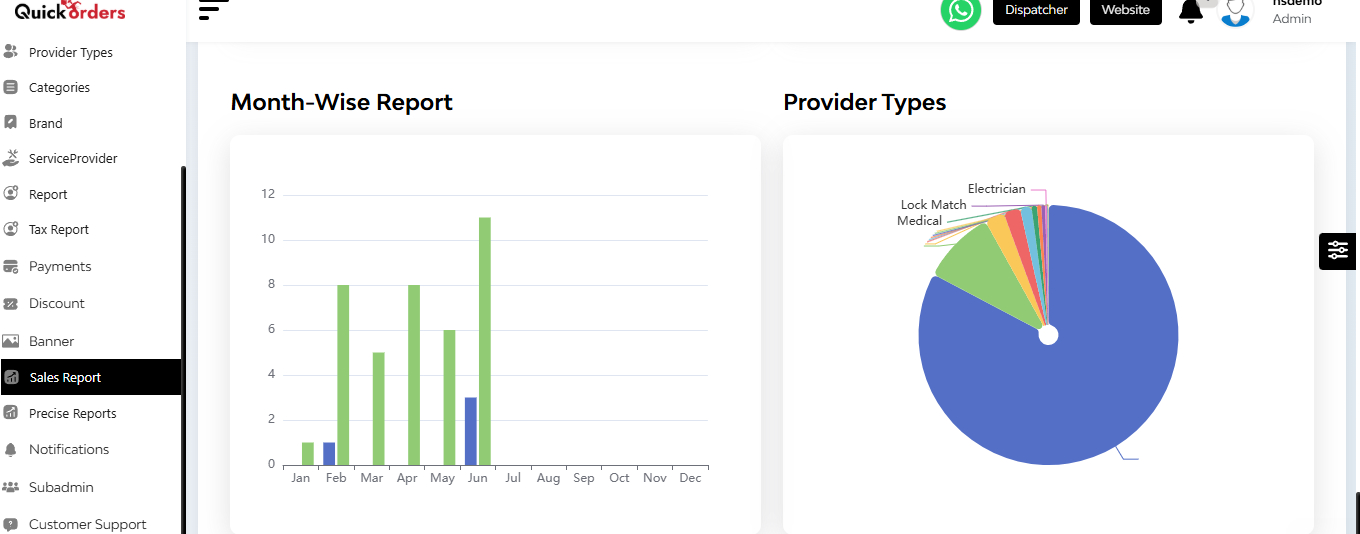
Month-Wise & Cuisine Type Breakdown

Revenue by Cuisine Types (Colour-Coded Pie Chart)
- Visualizes income by service type
- Helps identify which services contribute most to earnings
Monthly Income Comparison (Bar Graph Format)
- Compares current month vs. previous month total earnings
- Offers an at-a-glance view of financial growth or decline

