
Quickrides Knowledge Base Get Support 24/7
Sales Report
The Sales Report section offers powerful insights into the financial performance of your taxi booking platform, allowing admins to evaluate revenue generation across various parameters.
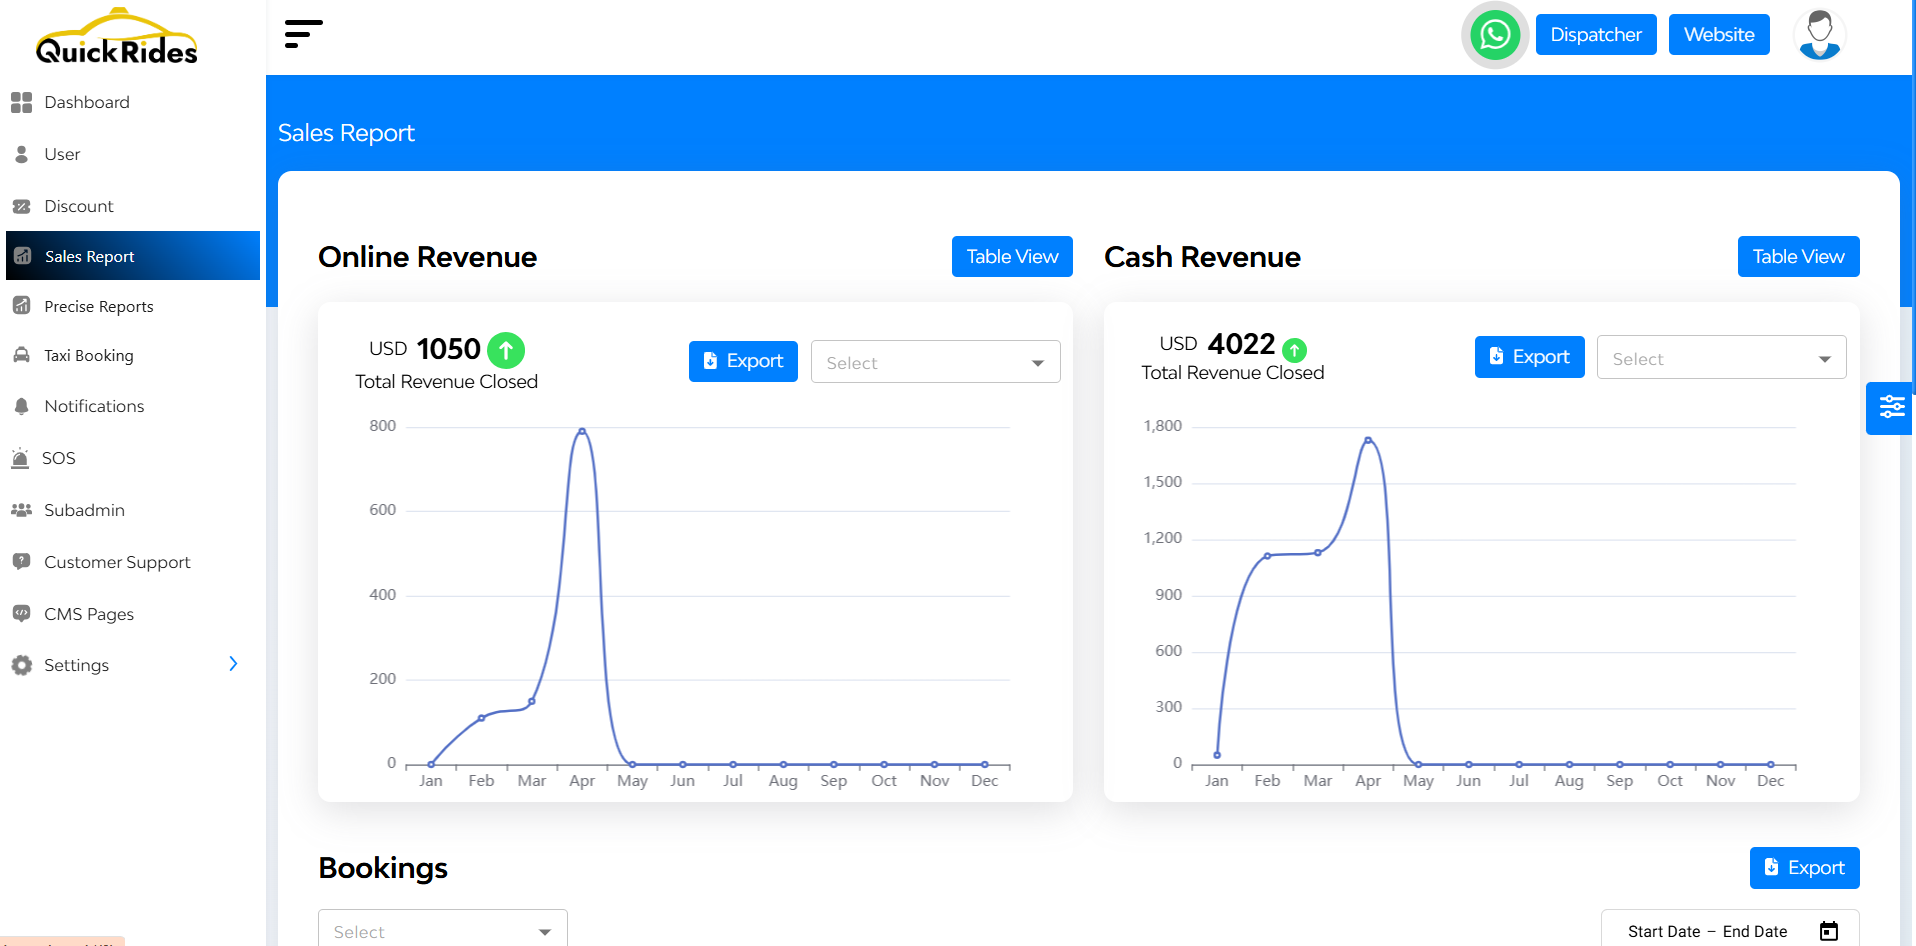
Here you can get a full visual and analytical view of the business’s revenue flow, category performance, and financial trends.
Monthly Revenue Overview (Interactive Line Chart)
- Displays daily revenue trends over the selected month.
- Highlights income fluctuations and peak earning days.
- Easily switch between months to compare historical trends.
Revenue by Service Category (Colour-Coded Chart)
- Visualizes income by service type (e.g., Taxi, Delivery, Rentals).
- Helps identify which services contribute most to earnings.
Monthly Income Comparison (Bar Graph Format)
- Compares current month vs. previous month total earnings.
- Offers an at-a-glance view of financial growth or decline.